Tech Tip: Diagnosing symptom based issues without fault codes
Most technicians have reliable examination procedures to determine the root cause of an issue when provided with a list of active faults on the vehicle. However, that procedure becomes more difficult when no fault codes are present and the technician must attempt to diagnose based on symptoms.
By listening to the customer complaint and test-driving the vehicle, technicians gain a clear understanding of the problem, but much work remains to pinpoint the exact cause. Fortunately, the data monitor feature within JPRO Professional can simplify this task and help solve symptom-based issues when no fault codes are present.
Imagine a customer arrives at your shop with his or her vehicle and complains of low power and increased fuel consumption when accelerating during an incline. You understand the problem, but also recognize there are enough possible causes to create a very lengthy diagnosis process. To simplify the process, open JPRO’s data monitor feature and create a custom data group.
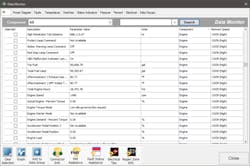
Data monitor contains a list of data points from every major component on the vehicle. To create a custom data group, users search, filter, and select which data points are of interest to their diagnosis needs and select "Add to Data Group." Users then simply save the custom group for repeated use on vehicles exhibiting similar symptoms.
For the low power example, we recommend you create a “Low Power and Fuel Economy Items” group (See image) and select all items that affect power and/or fuel economy. These data points come from all components that could cause the issue, such as the engine, transmission, body controller, etc. By test-driving the vehicle while running the custom "Low Power and Fuel Economy Items" group, JPRO captures all relevant data to assist in the diagnosis process.
After capturing the data, the next step is to look at all relevant items and determine where an anomaly occurs. For example, is fuel pressure meeting the minimum pressure requirements from that vehicle’s manufacture? Is boost pressure meeting the minimum requirements under a full load? Using your custom data group, you can answer these questions, find the deviations, determine the root cause, and repair the problem.
Now imagine solving this issue without the assistance of the data monitor. After hearing the customer complaint, you would look at each possible cause of low power until a manual process of elimination uncovers the issue. Data monitor automates that process, allowing for a quicker transition into the repair phase. By automating your diagnosis procedures, you can turnover bays quicker and ultimately improve profitability.
Information provided byNoregon Systems, Inc.