Content brought to you by Motor Age. To subscribe, click here.
What You Will Learn:
• Elusive faults can be discovered with a wide array of diagnostics techniques
• Ignition analysis can yield a heap of diagnostic data, and quite easily
• Scope graphing capabilities will allow you to see characteristics of what the scope is actually measuring
I remember the days when data-gathering and analysis were something I considered to be very challenging. This was before I learned to implement that game plan that we frequently reference here in the pages of Motor Age. Of course, having that game plan in place keeps us focused and avoids those times where we tend to drift off into the weeds or down into that rabbit hole. On occasion, though, I still find myself faced with a challenging drivability fault. Sometimes it's the tools we choose to implement and the results of a specific test that brings it all to the surface for us and provides that "nail in the coffin"—to sum up, a diagnosis. Stick with me and I’ll show you how viewing a piece of data from a different perspective gave me the confidence I needed to condemn an ECU, while the other available data left me pacing back and forth.

Today’s challenge
The vehicle that drove me nuts on this particular occasion was a beat-up contractor’s van. Yes, we all have that neighbor that we like to assist. Well, this was that neighbor’s van, and I agreed to assist. The subject vehicle was a 1994 Ford E250 with a V8 engine (Figure 1). The complaint was that the vehicle idled rough and on occasion, the engine would cut out and then regain consciousness. After speaking with my neighbor, it was determined that the engine would actually "stall and come alive again as if someone had shut off the key momentarily."
One thing I will state about a vehicle of this era is that it is pre-OBDII, and the available data is very slow and not what we are privy to on today's more advanced vehicle technologies. With that said, troubleshooting from the driver's seat will not yield me what it typically does. I will have to get my hands dirty on this one.
Performing some preliminary research is where I always begin my diagnostic approach. Understanding what systems, the vehicle is configured with allows me to determine what preliminary testing can be carried out easily, especially considering I’m at home, not at the shop. Of course, I began with a basic visual inspection. What I discovered was a catalyst (CAT) that was not doing its job. The fumes from the tailpipe were enough to choke a horse! Many of you realize that a CAT is a sensitive device and needs proper feed gas (from the engine’s output) to function properly. I was not yet concerned with the CAT’s performance, as I had realized it was likely a victim of the rough-running condition. Monitoring the HO2 sensors (pre- and post-catalyst) showed them to be operating erratically, and there were no DTCs flagged in the PCM’s memory. To me, this was a clue of a loss in fuel control. Again, I figured this to be the effect of the rough-running condition but not the cause. The vehicle was more frequently in open-loop than in closed-loop, so “faulty HO2 sensors” was near the bottom of my list of components to test.

Low cylinder compression/Timing faults
Worn ignition components (cap/rotor/spark plugs)
Rich conditions
Lean conditions
Weak coil output
Open/hard spark plug cables/poor connections
Excessive resistance
Short circuits
Bent distributor shaft
.")
Since the distributor is at the front of the engine, it was very easy to access. A simple connection was made between my ignition scope and the distributor coil input cable using a capacitive lead (Figure 2). Simply clipping this lead around the coil input cable offers a view of the electricity within the cable. This serves as a “cousin” of the actual kilovolts traveling within the cable’s insulation. Using the coil input cable, I was able to view the ignition events for all cylinders from just one testing location. The engine was started, and the data was captured for a few seconds and stored within the scope buffer. A view of the waveforms indicated very high firing kV. This was indicative of the ignition system having to work very hard, simply trying to fire the spark. Conditions like high compression, lean air-fuel mixture/large air gaps, and retarded ignition timing can create this situation. This capture is not from the subject vehicle but from similar circumstances (Figure 3). Although figure 3 was not obtained from the actual subject vehicle (picture was lost, whoops) it represents the results of an ignition capture from a vehicle with similar conditions.

I decided it was best to inspect the spark plugs, as they were not too difficult to remove, and the results of ignition analysis justified it. Not only were the spark plugs worn to an extremely large gap, but they were also white as ash, which provided evidence of a lean air/fuel mixture. I replaced the secondary ignition components to be sure they were not going to contribute to the symptom I was pursuing. After starting the vehicle, the engine still exhibited the same symptoms. Although the firing kV was still abnormally high, the properly gapped new spark plugs and fresh secondary components lowered the firing kV considerably. Of course, we should realize not only that the replacement of the components was necessary but also that their wear was a result of the underlying lean condition.
In pursuit of the lean condition
This is the point in the analysis where many technicians get ahead of themselves and take on the idea that a cylinder(s) is under-fueled because of an injector restriction. For those of you that were thinking this, I'm not going to say you are incorrect. However, I will suggest that rather than jumping to a pinpointed test like "injector balance," consider if the injectors are under-delivering—it may be due to an insufficient command from the PCM (an insufficient injector pulse width or “INJPW”).
. This indicates why the previous ignition analysis indicates a lean air/fuel ratio.")
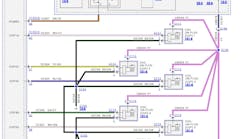
To capture this data is quite simple. With the use of the lab scope and referencing the wiring diagram (redrawn for easier view), we can determine where to place the probes so that the scope can display the fuel injector waveforms for all the fuel injectors, with only two test locations. This same diagram allows us to also see how the PCM strategizes to control the fuel injectors. It can be seen that all eight fuel injectors are controlled on the ground side by only two individual injector drivers within the PCM. One driver provides the ground path for all four banks 1 fuel injectors. The other driver shares the same responsibility but for all four banks 2 fuel injectors (Figure 4). Simply back probing these two wires allows us to see the command for all eight injectors as well as the pulse width. A fuel injector, being an inductive device, takes on the current through the bobbin (a winding of wire to carry an electrical current and take on a magnetic field). As the ground side-controlled injector is provided a ground path, the voltage on the controlled side (ground side) drops across the injector. During this time the circuit is held near ground potential and is known as the injector on time. When the PCM determines the end of the injector operation, the ground path is removed and the current ceases to flow. As a result, the magnetic field collapses and is converted back to electrical energy. This is the high inductive kick visible in the pattern (Figure 5).
Viewing the amperage trace on the lab scope can be carried out as well, but I chose not to in this case (for no particular reason). If I chose to deploy the vertical measuring cursors, I could Plot them between the point in the waveform where the injector was energized and where the injectors were de-energized to offer me a measurement of delta time (the elapsed time between the cursors). This would offer the actual measured INJPW. However, simply viewing the three successive injector events, it's clear to see that their on-time varies greatly (Figure 6).
- YELLOW= CKP/CMP input (Profile Ignition Pickup—described shortly)
- GREEN= Bank 1 Injector driver at PCM
- BLUE= Bank 2 Injector driver at PCM
As I scrolled my way through the captured data, I had a realization. These injector commands continued to vary as the engine ran with no change in driver input or load. Although not displayed, the same variation was going on with the ignition coil current ramps as well. Something very odd was going on here.
I referred back to the available engine data and saw no real change in any key inputs affecting the calculation for injector pulse width. I began to suspect that the PCM may be malfunctioning, whether due to an underlying fault or internal to the PCM itself. I ruled out system voltage/Alt. output as a potential fault, and it proved to be sufficient. I was left with nothing to measure but the inputs responsible for the timing and duration of both the fuel injectors and the ignition coil. These inputs are the PIP and the SPOUT signals.

Tracking the root cause
The P.I.P. is a camshaft position sensor/crankshaft position sensor, and it is internal to the distributor. It reports to the PCM and is used to determine the base timing and duration of the injectors and coil. The PCM uses other inputs to determine how to modify the injector pulse width and coil control for timing advance. The PCM will output a spark output (S.P.O.U.T) to the ignition control module to modify the timing of the coil and this same modification can be seen in the INJPW. The PIP input looked unblemished (as seen in the previous capture), but the erratically operating coil/injectors seem to follow the modified SPOUT signal (not displayed). I then decided to unplug the SPOUT connector and prevent the modified signal from reaching the coil. The coil dwell began to normalize and operated with a fixed dwell. However, the symptom still existed and the injectors continued to dwell erratically.
The good news is that I proved the PCM’s modified SPOUT signal elimination had the effect I anticipated. This led me closer to believing the PCM had an internal processing fault. The bad news is that a “faulty PCM" is still a hunch and at this point, I'm not ready to commit. I still desire more evidence to condemn the PCM, but how?
With my lab scope still connected to an Injector driver circuit, I recall scrolling through the channel menu of the scope. There, I found a selection to place the channel in a domain to display the measured-INJPW in “milliseconds” over an elapsed time (very similar to PICO Scope’s math channels).
What I'm eluding to is a vehicle that is at a steady state operation with no change in load or fuel demand should display the graphed data in a straight line (fixed pulse width) as time elapses. I hypothesize that the subject vehicle will output an INJPW that is not a fixed pulse width and will be reflected accordingly as graphed data that varies in amplitude as time elapses. Of course, this is just the hypothesis, but perhaps it will lead to a more confident diagnosis?
Since both injector control circuits reported the same activity, I chose only to monitor one circuit for the experiment. I started the engine and began to collect data for ten seconds across the scope screen. What I saw gave me great confidence (Figure 7). Using the vertical cursors to measure the difference in amplitude, there was a variation in INJPW of 3.7 milliseconds, in only two seconds of elapsed time. If this were truly called for, there would have to be a significant increase in load. And with the fuel system in open loop, I could immediately rule out the feedback system as the cause. It was time to shut the door on this case and call for a replacement PCM.
With the new PCM installed, the same test was carried out and as can be seen, the graphed data of INJPW exhibited a steady amplitude with no change in load (Figure 8). Along with that, the vehicle ran great, and the exhaust no longer smelled. The HO2 sensor operation as well as that of the CAT was restored and my neighbor was doing backflips!

Sometimes it simply takes a different perspective to allow you to see what once seemed not so obvious but is now clear as day. The functionality of the tools we have in our possession is not typically fully utilized. I urge you as a technician to spend some time with the tools you currently have and increase that return on investment. Being familiar with your tools of choice could save you time, make you money, and grow your knowledge simultaneously.