What you will learn:
- A logical diagnostic approach applied to hybrid vehicles as well
- Lab scopes eliminate guess work by proving the fault
- Understanding how a component or system functions is key to fault finding
Are hybrid diagnostics on heavy-duty vehicles any different than on a conventional diesel-powered heavy-duty vehicle? In my opinion, not really. Your diagnostic approach is still the same, and you still must know the fundamentals of electricity to proceed accurately and efficiently. If you know the fundamentals, you can tackle any hybrid system, with the proper tooling and service information. Diagnosing these systems is not as hard as you think.
Today's subject is going to be hybrid diagnostics. This vehicle’s hybrid system consists of a battery pack with an inverter and auxiliary power system (APS). The APS takes the high voltage from the battery pack and steps it down (to 28V DC) to run the low voltage electrical system on the bus.
Voltage is then supplied to the traction motor, mounted to the frame, in the engine compartment. It is directly mounted to the integral starter generator (ISG). The ISG and the traction motor make no direct connection. They are just bolted together for a more compact design.
Current goes through each of the motor stator windings from the supplied voltage of the battery pack. There are three phases that make up this traction motor rotor. The motor rotor is a brushless design, so it uses the three phases to put current into the stator windings, to either push or pull at the rotor (which is connected to the gearing that turns the driveshaft on the vehicle).
During deceleration, the inverter switches the circuitry to accept current from the traction motor, which is then sent back to the battery pack to help replenish it along with the operation of the ISG. These systems can be a little bit to grasp but once you understand the basics of how electric motors work, and what components are being used to control operation, they become easier to diagnose.
So, what’s the problem?
This bus has a symptom of bucking, back and forth, and the issue is intermittent. The problem was so bad that the operator refused to drive it. We then had to retrieve it and nurse it back to the shop. As soon as it got there, I grabbed my laptop and asked the other techs if they noticed any illuminated indicators on the dash. They told me the bus had an ABS light on and also a stop system and check system light on.
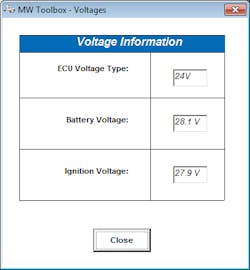
The first module I decided to connect to was ABS, assuming the symptom may be caused by a traction control issue. I scanned the vehicle, and the only code present was a J1939 timeout. I then looked at wheel speed data (Figure 1), battery voltage, and ignition voltage (Figure 2); everything looked ok.
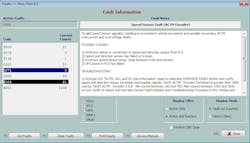
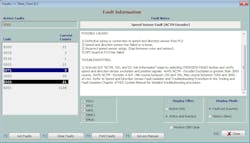
So, after looking at this data, I don’t believe the issue is ABS-related — yet. When analyzing a fault, collect all the data, look at all the modules, and see if anything correlates to your specific complaint. I then monitored the hybrid system using the factory IDS software. One code was stored, which set off an alarm bell for me: GO71: Speed and direction sensor (Figure 3). This Hall effect-type sensor is comprised of four circuits. Two of the circuits detect speed and the other two detect direction. The inverter or propulsion control system (PCS) receives these signals, so it knows the speed of the motor rotor, its direction of travel, and therefore, the proper time to energize each winding. This allows flawless rotation of the rotor. A fault with these circuits could indeed cause the symptom being exhibited.
If you look at the low frequency of the logged code, it does not make sense that the code and symptom correlate. The symptom was occurring quite a bit while the tech was driving it back to the shop. However, the speed sensor code was only logged three times.
Unfortunately, over the years, I have learned that with intermittent issues, sometimes the code count will not match the number of times the symptom occurs. Remember, the failure must cross the code thresholds for the software to log a code. So, in layman’s terms, if the fault has not crossed the code-set criteria, the controller will not log a code. A scope is the recommended tool to capture and analyze the fault.
It’s scope time!
Using two digital storage oscilloscopes (DSOs), I interfaced to the speed/position sensor. This sensor has six wires connected to it. One pair of wires is an excitation circuit and uses a 10V reference and a ground reference. There are also four speed-sensor signals.
I sampled from the reference circuit and ground (across the sensor) with my scope and “10V” was displayed. This circuit was healthy. The Pico 4425 DSO has 30V differential inputs on each channel, which makes it nice to check voltage drop across components.
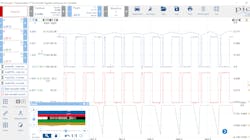
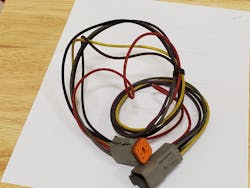
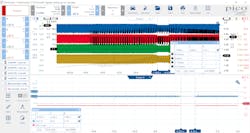
I then used my 6-pin Deutsch breakout lead to sample from all the sensor signals (Figure 4). I have two PicoScopes running at the same time. One scope display occupies the top of the PC screen, and the other occupies the bottom of the PC screen (Figure 5). The voltage and current for the sensor circuits are being displayed on the bottom scope (in blue and red). The sensor direction signals, and speed signals are displayed on the top scope (blue, red, green, yellow), and all signals appear “fuzzy” at the same point in time. The anomaly is visible in both upper and lower scope captures (as you can see when the vertical cursors indicate a delta-time reading of 1.3 seconds).
So, I then decided to deploy math channels for each signal circuit. The math channels allow me to view certain characteristics of the signal, rather than the actual signal itself (the black traces). This clarifies the signal being measured as the math channels convert each of the toggling-voltage signals into “RPM.” To do so required some creativity.
This traction motor has 90 reluctor teeth on the back of the tail shaft. These teeth pass by the sensor to generate the signal. I took the frequency of each signal on the scope and multiplied it by 60 (since 60 rpm equals 1 Hz, or one revolution per second).
I then divided the 90 teeth into the 60 rpm (equaling .66 Hz per tooth). You must enter this equation into the math channel function this way so the software can consider the frequency per tooth. This will yield the proper calculation.
< p>I then knew the exact rpm of each speed signal and could graph the rpm on the scope to catch glitches on longer time bases. The upper portion of the scope screen exhibits the issue (black traces). The top two speed channels represent the speed signals glitching. Keep in mind on this design, it only takes one signal failure to cause a sensor malfunction.The top two speed channels (red and blue) register 4.6 K rpm and 6.0 K rpm. This data is erroneous, as the vehicle is being driven very slowly around the shop. Said another way, the math channel is using “frequency” to determine rpm. If the frequency is toggling erratically/quickly, the rpm calculations will be skewed-faster. So, by looking at this capture, what can we decipher?
The answer
By looking at the scope we glean this information:
- The excitation circuit has proper voltage supply and ground reference (displayed in blue, in the lower scope), however, the trace is “fuzzy,” and the amperage trace (in red) is as well. There should not be this much “noise” on these circuits when referencing sensor ground, as I did.
- In the upper scope, the top two signals are glitching often. If there was no issue with the signal, there would be a steady increase in the black traces superimposed on the signal circuits (rpm).
- The yellow trace (signal to indicate the direction of motor travel) is not normal, either, because there is a fluctuation present (indicated by the momentary drop in amplitude for the black trace superimposed on top of the yellow). Because of this malfunction in the direction signal (yellow), and the malfunction on both speed signals (red and blue) this is causing our bucking concern.
- There doesn’t appear to be an issue with the green direction-trace.
- Deductive reasoning suggests it’s very unlikely all these circuits are experiencing a fault simultaneously unless a mechanical problem with the tone wheel exists.
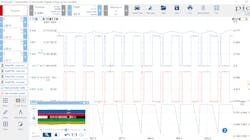
- A zoomed-in capture of the upper scope displays the red and blue signals are being pulled to ground erratically, but they should not be (Figure 6).
I then removed the sensor from the back of the drive unit and found it to be severely damaged (Figure 7). The damage to the sensor caused the malfunction to occur. The erratically fluctuating magnetic field allowed the sensor to switch (or toggle) erratically. The sensor and tone-wheel clearly came into contact so, replacing just the speed/direction sensor will not solve this issue. To correct the root cause failure, the traction motor assembly required replacement.
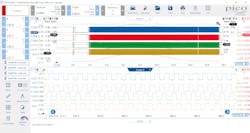
After showing the damage to BAE, two months had passed and finally, we received/installed a new traction motor assembly. The bus ran great after that. A capture of the same data was obtained, after the fix (Figure 8). As can be seen, the now properly reporting speed signals yield smoothly increasing rpm/direction (black traces), as the vehicle speed increases, and decreases.
With some basic knowledge of hybrid system operation and some electronic/equipment experience, you will be able to diagnose these issues more easily. Don’t be afraid of this new technology, as it will be more prevalent as time passes. Embrace it.
About the Author

Michael Eilbracht
Michael Eilbracht is a transit bus technician for the Champaign and Urbana Mass Transit District in Urbana, Ill., and is the owner of MJE Diagnostics, a heavy-duty mobile diagnostic and training business. He is also an ASE Certified Master Transit Bus Technician and also holds an Advanced L2 Certification.
