The evolution of automotive scan tool technology
Content brought to you by Motor Age. To subscribe, click here.
What You Will Learn:
•How and why scan tool technology has evolved
•The benefits of scan tool topology mapping
•Why viewing data in a graphed format will streamline your diagnostics
Although quite a few years ago, it still feels like yesterday (to me, at least) that we struggled to obtain data from the scan tools at our disposal. Relative to what we have come to know today, they were slow, clunky, and some required external power/ground sources to operate. Undesirable to use, by today’s standards.
The birth of the scan tool
My journey began at an Oldsmobile dealership in the late ’90s. I recall dreading the use of the scan tool, GM TECH1. As I mentioned above, the tool required an external power source (as the ALDL, or Assembly Line Data Link) and didn’t support scan tool voltage or ground feeds. Instead, a power supply cord sourced voltage and ground at the cigarette lighter port. Often, the fuse for the cigarette lighter was blown or the port itself was filled with ash and other undesirables, making access to the port near impossible without a thorough cleaning. Another option was to run a cord out to the battery under the hood.
However, when I did get this ancient scan tool to function, it served its purpose. I was able to:
- Scan for DTCs
- Monitor live data parameters (PIDs)
- Perform some miscellaneous tests (bi-directional control)
- Obtain a snapshot of data
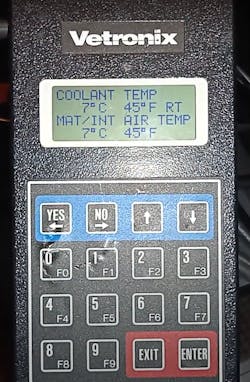
The scan tool was quite functional for its time and helped to fix a lot of broken cars. But the tool lacked a few things that I find to be extremely important, especially as a diagnostician. For one, I could only monitor two pieces of data simultaneously (Figure 1). This limited amount of data made action/reaction testing a bit of a challenge in some situations. Many times, mining data from vehicles of this era meant intruding upon the circuit itself, rather than retrieving it via scan tool communication. It was neither fun nor an efficient way to begin a diagnosis.
The second gripe I have with a tool of this era is that there is no graphing capability. Being able to view data in a graphical format has a lot of benefits. First, the ability to reference graphed data provides for a history of the scan tool PID. One doesn’t have to stare at the display to capture a fault. You could simply scroll back in time to see the fault present itself in the captured data.
But one of the most difficult challenges a tech would face today in using a scan tool of this era is the fact that the refresh rate was terribly slow. The UART network (or Universal Asynchronous Receiver/transmitter) is the protocol that GM utilized at that time which was limited to less than 10,000 bits per second. Compare that to some of today’s faster automotive protocols boasting 50,000,000 bits per second. The vast amount of data that is shared between vehicle node and scan tool will completely overwhelm such a slow protocol, rendering the tool virtually useless by today’s vehicle standards. This leads me to my next point: scan tools had to evolve with vehicle technology.
The progression in scan tool technology
As time passed and vehicle technologies were enhanced, some more advanced creature comforts were now possible. Systems like advanced traction control, as well as the now computer-driven functions that replaced manual systems (power windows/door locks, and computerized climate control, for instance) all demanded a faster ability to transfer data. In 2008, came the OBDII mandate that vehicles must communicate certain data over a Controller Area Network (the CAN bus). With the possible speed of data transmission reaching 1M bit/sec, the evolution of the scan tool was in demand.
With this new technology came the ability to view an abundance of data very rapidly. Limiting a scan tool PID list to less than ten pieces of data could still yield a scan tool refresh rate of about 50mS. Said another way, the data being viewed would update about 20 times per second. That’s as close to “live” as you can get with processed data derived from a scan tool.
But, equally as important to me as the speed and the simultaneous/multi-PID view was that ability to graph the data out. Capturing and viewing data in this fashion allows for a story to be told and questions about the exhibited symptom to be answered. The questions are:
- What is causing the exhibited symptom(s)?
- How is the ECU reacting to the fault?
- Can the ECU compensate for the symptoms?
- What is the root cause of the fault?
But this same CAN protocol technology that yields us so many of these analytical benefits also has its share of challenges that technicians had to learn to overcome. With these newer CAN bus protocols (and other communication network configurations of today’s era), technicians had to deal with network failures. This posed a challenge as previous configurations simply “hard-wired” the components to electrical switches, or the ECU itself. When a component failed to function (or functioned undesirably) a technician was typically focusing on a single circuit.
However, in today’s day and age, it’s quite common for a technician to encounter a vehicle experiencing a failure of a system, related to a loss in network integrity. Components now operate on a virtual system platform by way of this bus communication, as computers now share data. A fault could be something as simple as an open circuit or as complicated and challenging to pinpoint as noise from an outside source, destroying a communication signal and disabling the network from data transmission.
Lacking technology can create bottlenecks
The process of elimination for properly operating components, and the process of isolation for the suspected cause of the fault can be quite extensive. If you reference the link above for a previous Motor Age article, you’ll read that I have well over eighteen hours invested in the location of that fault. Should I have found it sooner? Well, ‘hindsight’ is always “20/20” but, “yes,” knowing what I now know, I should’ve located that fault upon a preliminary visual inspection.
But let’s revisit that. During my initial approach of the vehicle, I encountered 32 DTCs stored in 16 different ECUs, on at least two different network protocols. The time to note all the DTCs, clear them, and see which returned was a lengthy task. I noted that many of the communication DTCs indeed returned.
The process of isolation began and after several hours of invested time (referencing wiring diagrams on a PC across the shop, and locating connector terminals under the dashboard), I determined the network fault to only be present with the Body Control Module (BCM) connected to the network. Bypassing the BCM eliminated the noise from the network. Although the actual cause was due to incorrect headlamp bulbs, it took the elimination of the BCM to pinpoint the fault. The point is, although the vehicle was successfully diagnosed and repaired, way too much time was invested.
The birth of the network topology map
Time continues to pass, and technology continues to expand, which includes that of the scan tools’ capabilities. Today’s technology allows for topology mapping. This gives the technician a tremendous advantage. With this capability, the technician can have a bird’s eye view of the networks on that vehicle’s platform. The networks are connected to the ECUs on the map, just as they are in the vehicle, and display how they communicate data to one another.
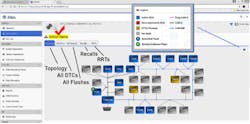
This technology was first seen on the OEM scan tools. I first witnessed this capability with my introduction to FCAs Wi-Tech. I was amazed at how intuitive it was to use. The software color-coded each component on the network, dependent upon the status of the ECU (Figure 2). This made it very swift and easy to detect an ECU (or, portion of a network) that wasn’t communicating. The ability to determine if an ECU had stored DTCs was just as simple and intuitive. From that initial screen, one could even determine if a software update was available. Simply clicking on the highlighted node would streamline you directly to that node specifically. Here, you could access PIDs, or even implement bi-directional controls and other special functions. It serves more like a diagnostic suite than it does a traditional scan tool, as we used to recognize them. Chrysler wasn’t the only OEM to go this route. Other manufacturers followed suit, like BMW's ISTA scan tool software (Figure 3), for instance, and for the same reasons. It made the analysis far more streamlined.
When it comes to diagnostics, the benefits of topology mapping are plentiful. Besides the benefits of the feature mentioned above, having that “lay of the land” view allows the tech to begin to strategize on how he or she is going to approach the fault, right from the driver’s seat. By viewing the topology, the process of elimination begins. The tech can simply ignore the impossible to begin focusing on what is possible and eventually, probable. The result is avoiding the situation I encountered with the example I gave earlier.
OEM capability found in aftermarket scan tools
These great benefits can be yielded when investing in factory scan tools. But many times, the cost involved in the ownership of these tools can be a turn-off to some shop owners and technicians. They can’t seem to realize the return on investment as they can with other, more frequently implemented tools. Although the National Automotive Service Task Force (NASTF) offers J2534 access to many of these factory tools, many shops are still more comfortable owning a handheld scan tool with a wide range of coverage.
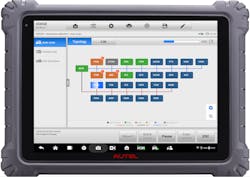
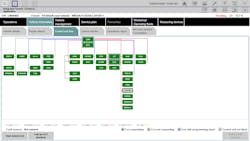
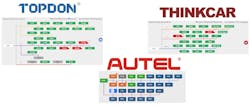
There is still good news for those that chose the “handheld aftermarket” route. This topology mapping has made its way to the aftermarket scan tools as well. Many manufacturers like Topdon, Autel, Launch, and Thinkcar (to name a few) possess the same topology capabilities as the OEMs (Figure 4). What’s more, the scan tools don’t just focus on one manufacturer’s make. They cover a range of years/makes/models just as we’ve come to expect from aftermarket scan tools.
Some other features make these aftermarket scan tools quite impressive. Autel (for instance) has partnered with Motor. The service information database is now available with Autel’s advanced diagnostic tablets. The database provides technicians with color-coded wiring diagrams, component locations, and such. This means service information and topology mapping are on the same page! And you still have push-button streamlined access to the individual nodes, as described earlier. Some of these above-mentioned tools take it a step further by identifying the multiple protocols accurately, in different colors, on the topology map (Figure 5). This is certainly a benefit aiding in loss-of-communication diagnoses, that not many of the other scan tool companies are doing just yet.
Technology has come a long way and it’s only going to continue to improve as the need for robust service data and scan tool capabilities will continue to grow. With this new technology featured in today’s aftermarket scan tools, data mining and analysis is not as difficult as it was in years past. Take advantage of the tremendous technology we have available to us.
